/ ISPRS CATCON 9 · JUDGES’ PACKET

Remote Sensing Teaching and Practice Platform for Flood Analysis and Student Interaction

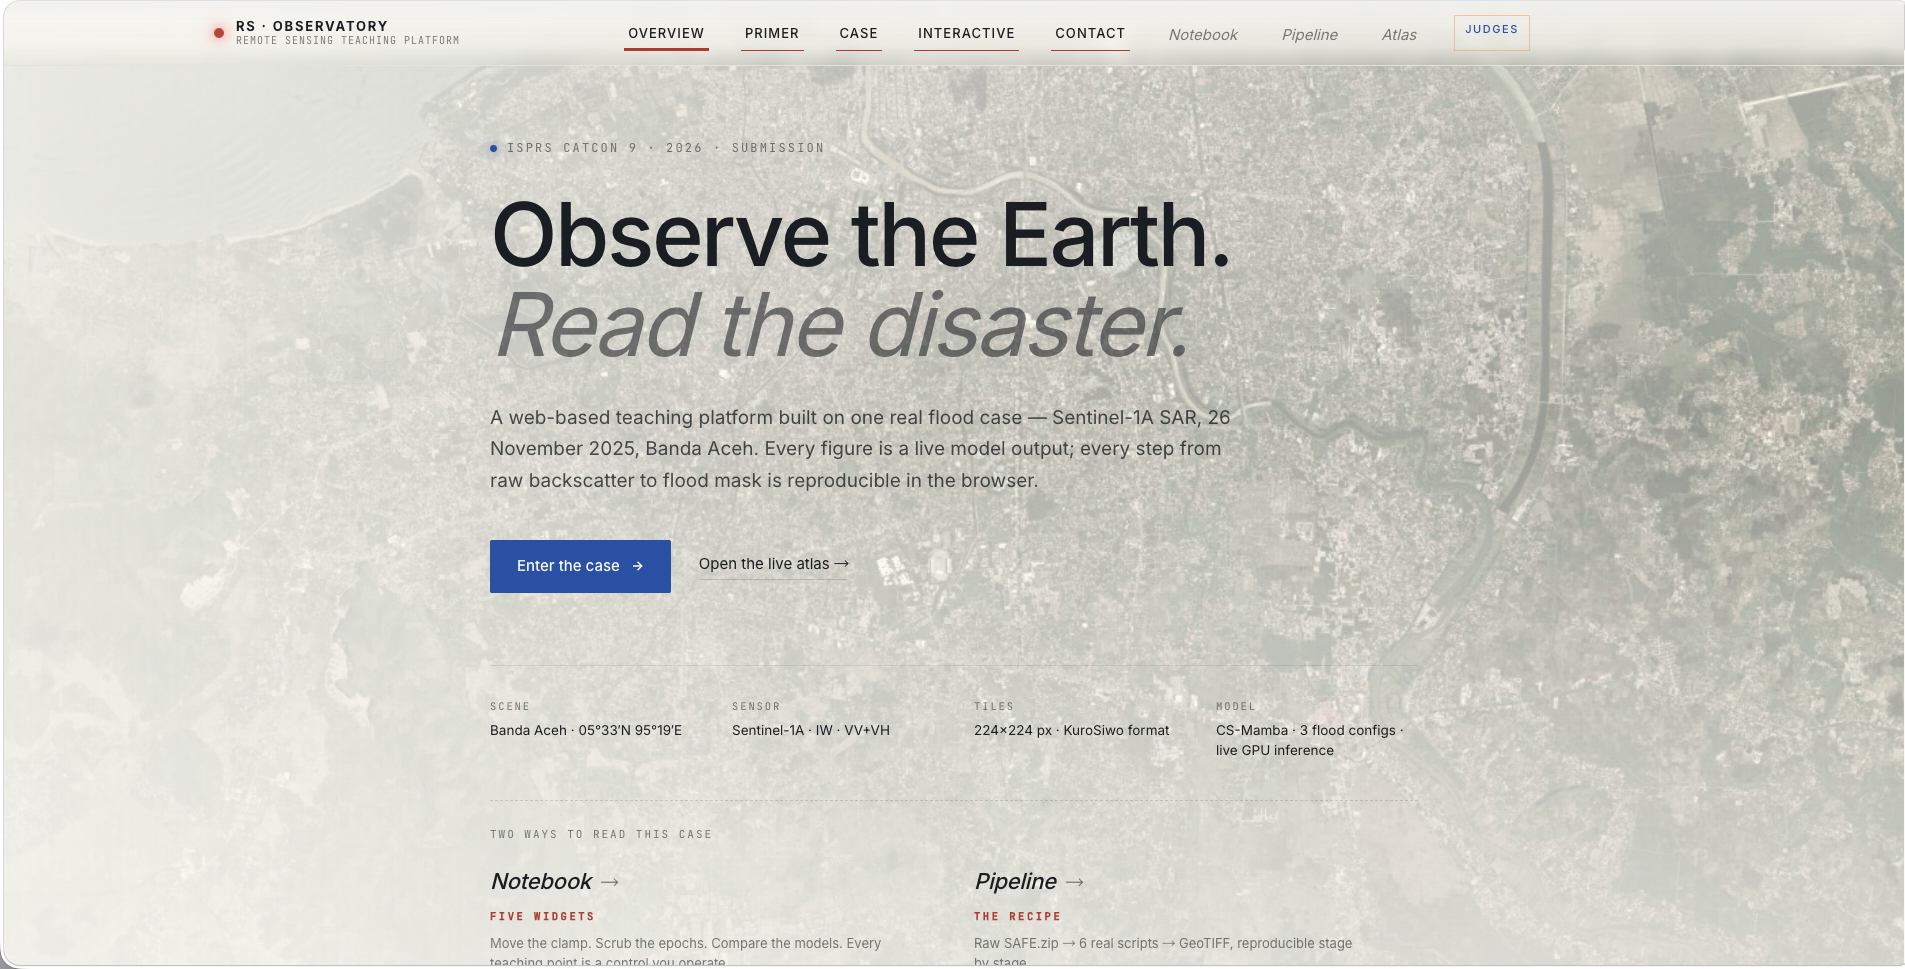
A web-based teaching environment built around a real Sentinel-1 SAR flood case — every figure is a real model output, every step is reproducible, and students close the loop with guided inquiry.

TITLERemote Sensing Teaching and Practice Platform for Flood Analysis and Student Interaction
CATEGORYWeb information package · education-oriented
DEADLINE2026-04-24 · initial evaluation
/ 01 · DESIGN CONCEPT & PURPOSE

Teach remote sensing the way it is actually practiced.

Traditional remote sensing courses show finished maps and finished equations. This platform teaches the workflow — the messy middle where raw satellite archives become decisions. We pick one real disaster event, one operational SAR pipeline, and one clearly-explained segmentation model, and we walk learners through it from L1C GRD to interpreted flood map without hiding the steps.

The purpose is three-fold: (1) give undergraduates an intuitive first contact with SAR; (2) give graduate students a reproducible end-to-end pipeline they can rerun and modify; (3) give instructors a self-contained case they can drop into a one-hour lecture.

/ 02 · METHODOLOGY & VALIDATION

Teaching a workflow, tested on a scene the model has not seen.

The flood-segmentation model at the centre of this site was trained and validated on KuroSiwo (Bountos et al., 2023). The case shown throughout — a Sentinel-1A acquisition of the 2025-11-26 Banda Aceh flood — post-dates the dataset and is not part of it. What learners watch is generalisation under a single preprocessing hyperparameter, in a radar regime that runs 5–8× brighter than the training mean.

We frame this as a qualitative, out-of-distribution evaluation, not a test-set accuracy claim. The table below condenses the facts that make it one; the Claims & Limits block that follows spells out what the demonstration does and does not support.

Validation at a glance

The model was trained on KuroSiwo. The scene shown throughout this site was acquired afterwards and is out of distribution. What you see below is generalisation under a single preprocessing knob — a teachable observation, not a test-set accuracy claim.

Training data
KuroSiwo (Bountos et al., 2023) — a global, multi-temporal flood dataset of 33 B m² of labelled water.
Evaluation scene
Banda Aceh · 2025-11-26 — acquired two years after the KuroSiwo cutoff and not in the dataset.
Distribution shift
VH backscatter runs 5 – 8× brighter than the KuroSiwo training mean (tropical vegetation, saturated paddies).
Adaptation
A single inference-time hyperparameter (input clamp). No retraining, no fine-tuning, same weights.
Outcome
With clamp = 0.30 the model recovers a sensible flood map — flood / water / land ≈ 4.2 / 5.1 / 90.7 %.
Failure modes shown
clamp = ∞ → noisy; clamp = 0.15 → 71 % of VH pixels saturate and the flood disappears.

What we claim

  • The 2025-11 Banda Aceh scene is correctly out-of-distribution for this checkpoint.
  • A single inference-time hyperparameter (input clamp) recovers a sensible flood map — no retraining.
  • The interactive panels show real, reproducible model behaviour on an unseen scene.

What we don’t claim

  • That 
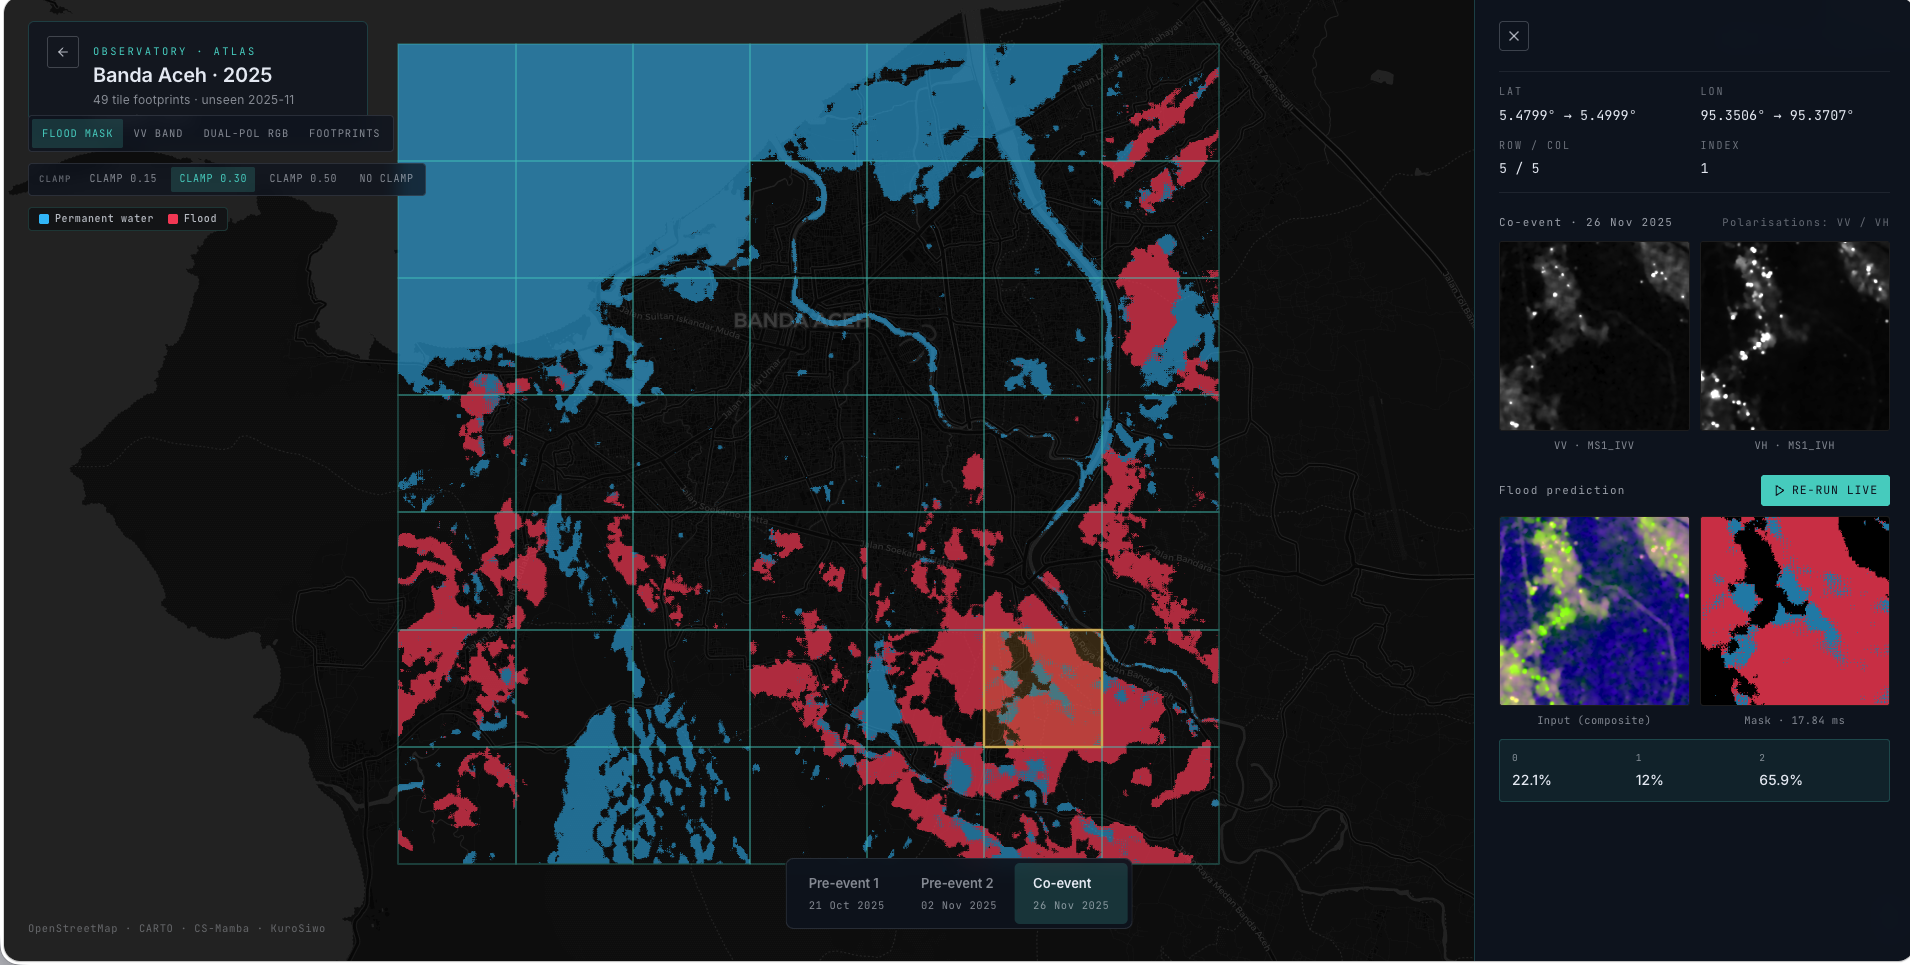
clamp = 0.30 generalises to every future OOD scene — it happens to be the right knob here.
  • That this pipeline outperforms any state-of-the-art flood-mapping benchmark.
  • That qualitative OOD evaluation replaces quantitative held-out metrics for operational use.

How you could falsify us

  • Open the Atlas, pick any of the 49 tiles, press Run in LIVE mode — and see where the recovery breaks.
  • Re-run the pipeline with reproduce-no-sar on a different Sentinel-1 scene.
/ 03 · BRIEF DESCRIPTION OF FUNCTIONS

Six functions, one teaching loop.

SAR physics primer

Ninety-second explainer pairing VV/VH/RGB imagery with backscatter intuition for first-time learners.

End-to-end flood case

Banda Aceh 2025-11-26 case from raw Sentinel-1 GRD through Cross-Scale Mamba (CS-Mamba) prediction to side-by-side comparison.

Walkable 6-stage pipeline

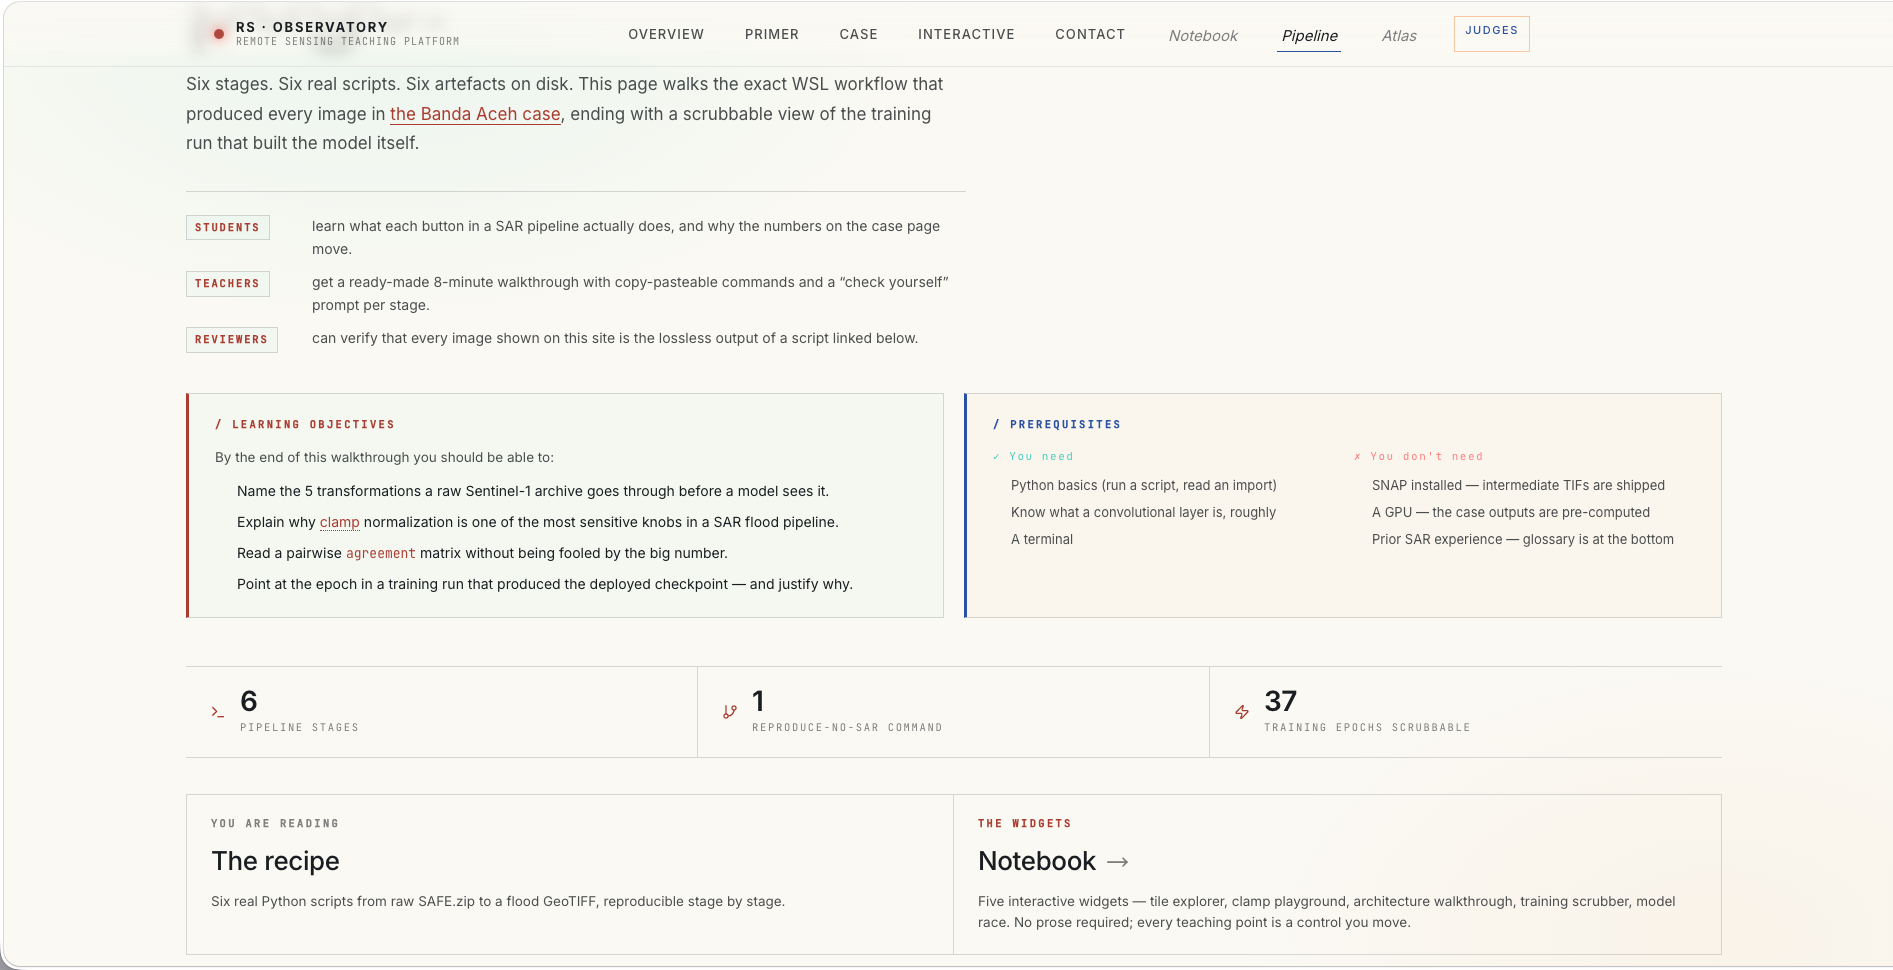
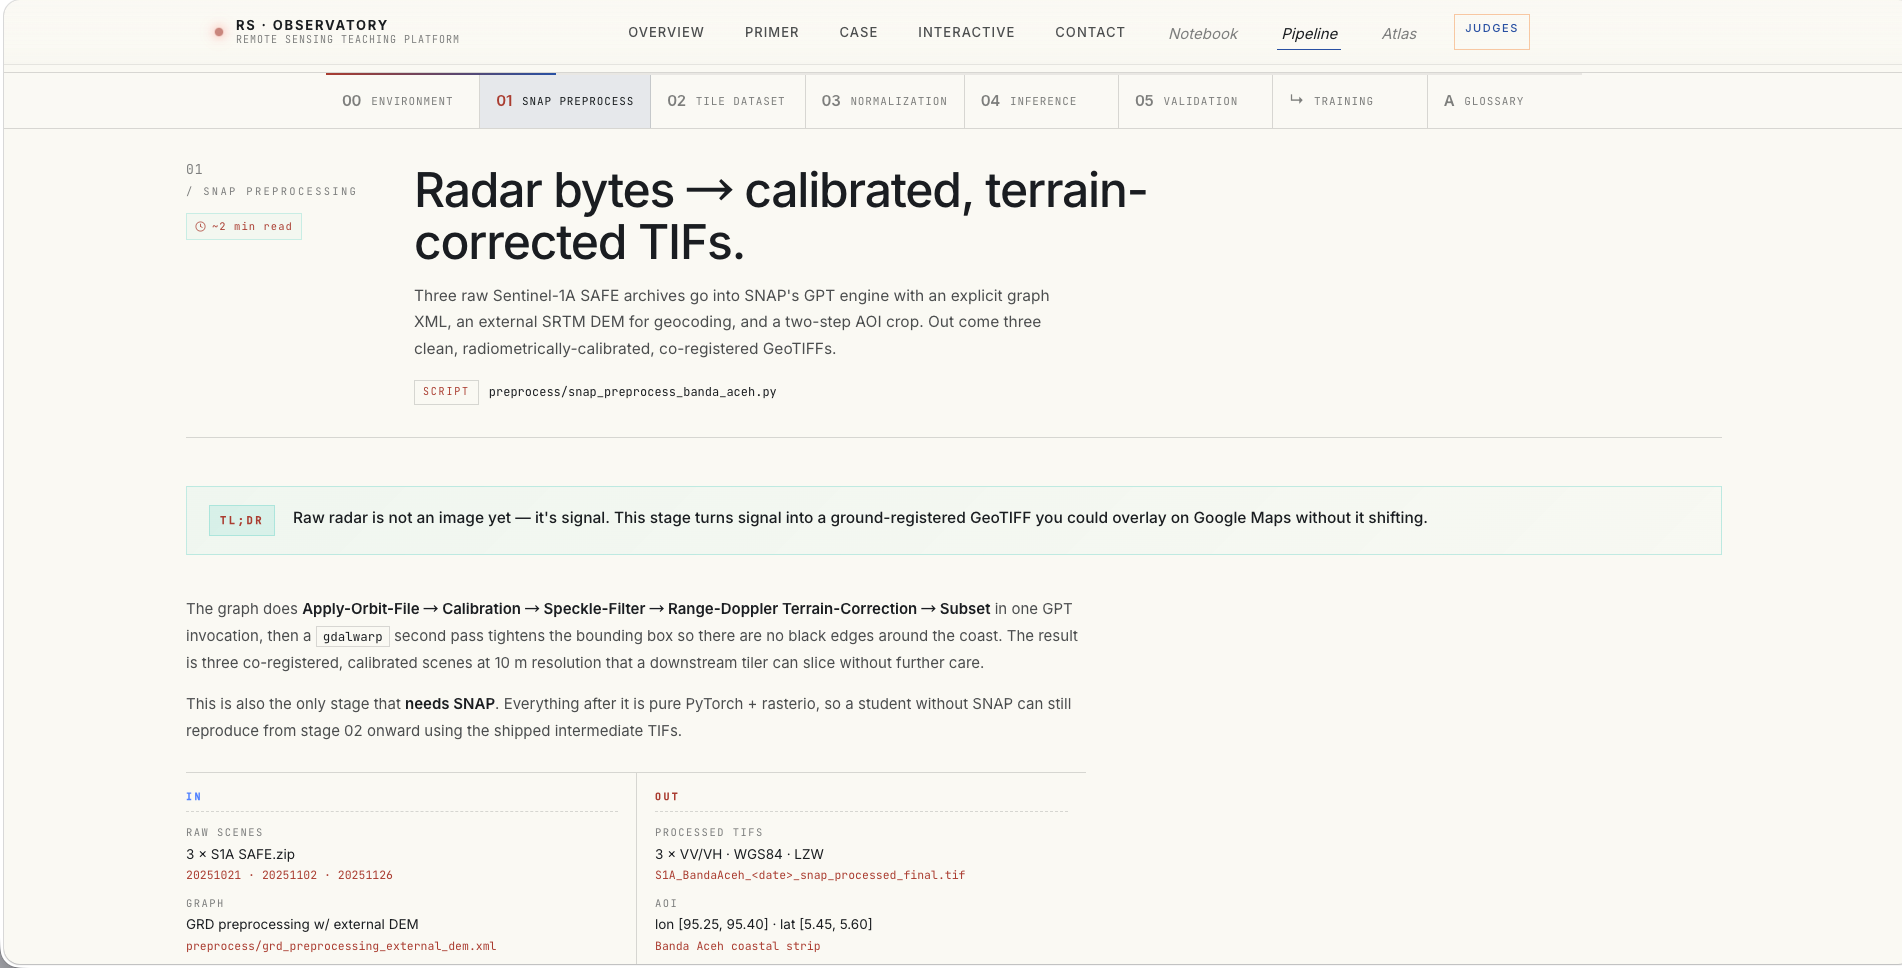
Scrollable `/pipeline` page with real commands, artefacts, TL;DR and check-yourself prompts per stage.

Explorable-explanation notebook

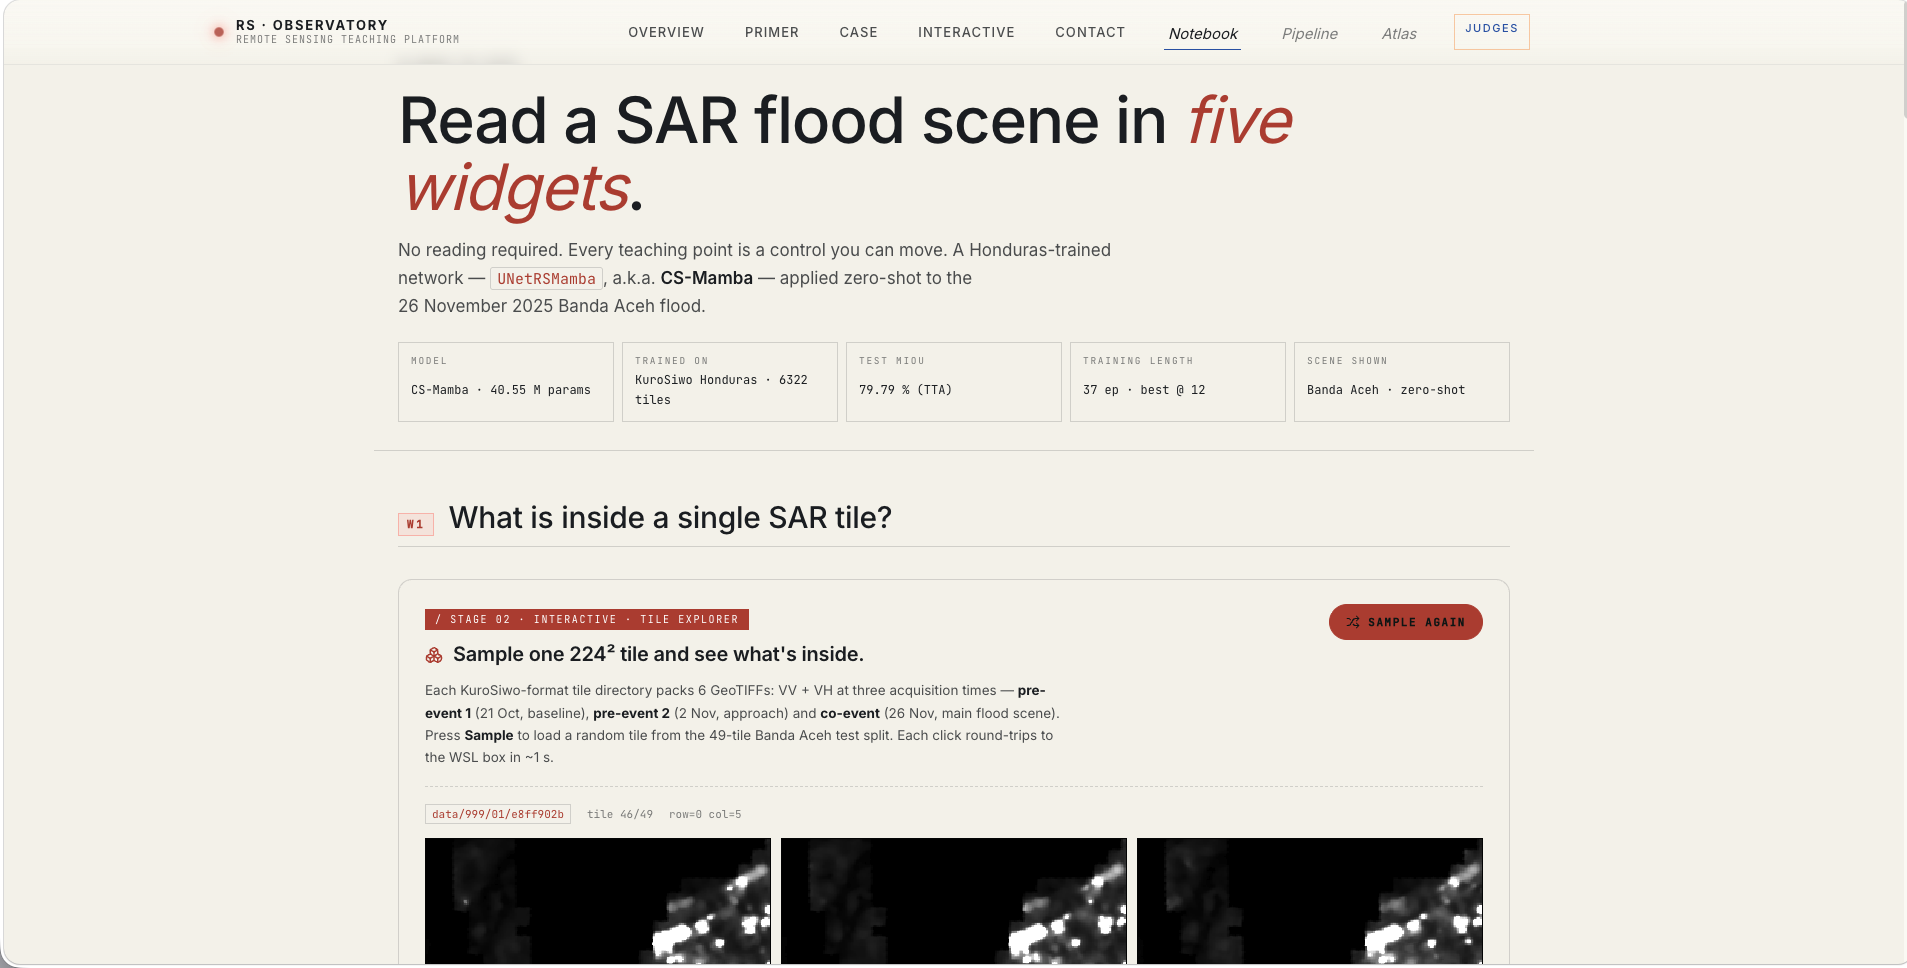
`/paper` presents the model as five interactive widgets — tile explorer, clamp playground, architecture walkthrough, 37-epoch training scrubber, model race. Every teaching point is a control the learner operates, not prose.

Student inquiry loop

Feedback form wired to Cloudflare Workers + D1 so classroom questions and data requests reach the teaching team.

Reproducible artefacts

Every image on the site is a real output; pipeline reruns with one command on the provided dataset.

/ 04 · TEAM

Name, affiliation, country, email — as required by CATCON.

Primary contact: Wei Yuan (wei.yuan@tohoku.ac.jp). All five members are confirmed and available for Congress correspondence.

RoleNameAffiliationCountryEmail
Principal Investigator · Team Lead Wei Yuan International Research Institute of Disaster Science (IRIDeS), Tohoku University Japan wei.yuan@tohoku.ac.jp
Ph.D. Candidate · Model & Data Engineering Zhongyuan Yang International Research Institute of Disaster Science (IRIDeS), Tohoku University Japan yang.zhongyuan.t2@dc.tohoku.ac.jp
Ph.D. Candidate · AI Methodology Weihang Ran OSCARS Lab, Graduate School of Information Science and Technology, The University of Tokyo Japan ran-weihang@g.ecc.u-tokyo.ac.jp
Professor Emeritus · Funding Support and Advice Ryosuke Shibasaki Center for Spatial Information Science, The University of Tokyo Japan rshibasa@reitaku-u.ac.jp
Director · Funding Support and Advice Shunichi Koshimura International Research Institute of Disaster Science (IRIDeS), Tohoku University Japan koshimura@tohoku.ac.jp
/ 05 · SYSTEM REQUIREMENTS

Browser is the whole client. The rest is optional.

For judges and learners (viewing)

Browser
Chrome 110+, Firefox 110+, Safari 16+, Edge 110+
Screen
Works from 360 px (mobile) to 4K desktop
Network
Any broadband; total page weight under ~10 MB
JavaScript
Required (ES2022)
Account
None — fully public, no sign-in

For reproducers (rebuilding)

Frontend
Nuxt 3 · Vue 3 · TailwindCSS · @nuxt/image
Backend
Cloudflare Workers · D1 SQLite
Modelling
Python 3.10 · PyTorch 2.x · SNAP 9 · rasterio
Build
Node 18+, pnpm or npm
Deployment
Cloudflare Pages (static) + Workers (API)
/ 06 · ORIGINALITY STATEMENT

Why this is not just another course website.

  1. 01 The segmentation model itself is original research: Cross-Scale Mamba (CS-Mamba), our SAR-specific extension of RSMamba (Chen et al., 2024), submitted to the ISPRS 2026 Congress — the qualification on which this CATCON entry stands.
  2. 02 Built around a single real disaster case rather than a catalogue of toy datasets.
  3. 03 Parameter sensitivity is taught as a first-class lesson: the same model, four input-clamp configs, four visibly different flood maps.
  4. 04 Every figure on the site is a real model artefact — no stock images, no staged screenshots.
  5. 05 The teaching loop closes with an inquiry form backed by Cloudflare Workers + D1, not a mailto link.
  6. 06 Pipeline page exposes real shell commands and file layouts so students can rebuild the case at home.
/ 07 · TARGET LEARNERS

Three personas, three entry paths through the platform.

UG

Undergraduate RS student

Goal: First contact with SAR; wants intuition plus one full worked example.

Path: Home → Primer → Flood Case showcase → inquiry form for questions.

PG

Graduate / MSc student

Goal: Wants to reproduce the pipeline and understand parameter sensitivity.

Path: Pipeline page → Training replay → clone toolkit → run `reproduce-no-sar`.

INS

Instructor preparing a lecture

Goal: Needs a self-contained case they can project and discuss in one session.

Path: Flood Case showcase → teaching-flow prompts → discussion questions.

/ 08 · SUPPORTING MATERIALS

Six screenshots and a one-page PDF, for judges who skim.

Six frame grabs from the live deploy plus a one-page PDF summary — all SHIPPED. The live site is itself the walkthrough.

Screenshots (3–6)

SHIPPED
Homepage hero with the tagline "Observe the Earth. Read the disaster.", aerial Banda Aceh backdrop, meta chips for Scene / Sensor / Tiles / Model, and the two-way reading shelf pointing at Notebook and Pipeline.
01 · Site hero and entry points
Atlas page: KuroSiwo tile grid over Banda Aceh with CS-Mamba flood prediction rendered on top of the OpenStreetMap basemap, a right-hand tile inspector showing VV and VH composites, and a live GPU prediction mask returned in 17.84 ms.
02 · Atlas with live flood inference
Paper page (`/paper`) with hero "Read a SAR flood scene in five widgets.", meta strip (Model, Trained on, Test mIoU, Training length, Scene shown), and W1 Tile Explorer showing the three-panel VV timeline static fallback.
03 · Notebook — five interactive widgets
Pipeline page (`/pipeline`) hero with STUDENTS / TEACHERS / REVIEWERS personas, learning objectives, prerequisites, and the 6 stages / 1 reproduce-no-sar command / 37 training epochs stats strip.
04 · Pipeline overview
Team section with the five members: Wei Yuan (PI, Tohoku IRIDeS), Zhongyuan Yang (Ph.D. candidate, Model & Data Engineering), Weihang Ran (Ph.D. candidate, AI Methodology), Shunichi Koshimura (Director, Funding Support and Advice), Ryosuke Shibasaki (Professor Emeritus, Funding Support and Advice), each with a role, affiliation, email and contribution list.
05 · Team and contributions
Pipeline stage 01 detail view: SNAP preprocessing script, TL;DR callout, IN/OUT tables showing raw Sentinel-1 SAFE.zip inputs and calibrated GeoTIFF outputs.
06 · Pipeline stage 01 · SNAP preprocessing